The Elasticsearch tagline is “you know, for search”. But in our case, also for science. At Servicelab, we’re using Elasticsearch, Logstash and Kibana to monitor and analyze a Smart Grid pilot. Read on for the why and how.
What’s The Deal with Smart Grids?
Whether you like it or not, photovoltaics, wind, and more exotic energy sources like blue energy are here to stay. World + dog are pushing for renewable energy sources, which means that soon our traditional, centralized electricity grid won’t be able to cope with the huge fluctuations in supply and demand that come with the territory. Enter Smart Grids and a whole world of research about monitoring and controlling all areas of the electrical grid, up to and including electrical devices in your own home.
At Servicelab, we participate in several Smart Grid projects and pilots around Europe. One of them is the EcoGrid EU project, which uses the Danish island of Bornholm as a test bed. A large number of households participate in the pilot. We are controlling residential heat pumps – devices which basically use a lot of electrical energy to store and produce heat – in some of these houses. We control these pumps with PowerMatcher, a multi-agent, market-based control algorithm.
Pilotitis, Revisited
When you’re participating in a pilot there is a certain scientific component which you must address. You usually do that by gathering data and doing some kind of analysis of that data. We also want to monitor if everything is working as it should on Bornholm on a somewhat real-time basis. We had a number of challenges to solve in getting the data we need:
- Part of the PowerMatcher control logic runs on the island of Bornholm itself, the other part runs in The Netherlands. This means going through all kinds of hoops to actually getting the data.
- PowerMatcher has no way of telling you that the households you are currently controlling are currently responding to your command or giving you good data. So we had no real way of doing real-time monitoring.
- The numerical data we needed for off-line analysis was buried deep in mountains of log files. That’s a lot of text to analyze for people who are used to using Matlab for everything.
It’s very tempting to just keep on using your old tool set in these kinds of situations. There’s just this pilot, right? We just have to use this triple SSH tunnel one more time, right? We just have to use find-replace on all these log files one more time, right? When pilotitis hits again and “one more time” gets repeated more than three times, it’s time to think about a better solution.
Elasticsearch, Logstash and Kibana
We’d been playing around with Elasticsearch for another project we were doing and we were impressed by the way you could do full-text search on a mountain of data. We heard rumors about a fancy tool of pulling log files into Elasticsearch (Logstash) and another fancy tool we could use to make pretty pictures with all that data (Kibana). They even have a cool name for these three tools: the ELK stack. So why not give them a try?
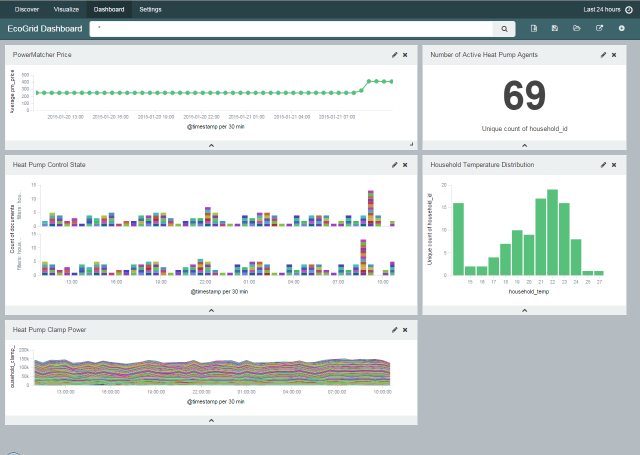
Something about pictures and a thousand words. Here’s our dashboard.
The ELK stack has made our life so much easier and has been instrumental in cases where previously we just couldn’t figure out why stuff wasn’t working. We’ll be using it for other Smart Grids projects as well.
For EcoGrid, we ended up with the following configuration:
- A Logback SSL appender configured in Bornholm to get PowerMatcher log messages to Servicelab. This proved to be the simplest solution since it PowerMatcher uses Logback by default and it only involved a small change to logback.xml.
- A small custom daemon running at Servicelab which does the Logback SSL listening and simply forwards all logback messages to Logstash using this excellent library.
- Logstash running at Servicelab. It does the grunt work of parsing numerical values out of log files. We were interested in sensor readings (power and temperature) and the internal PowerMatcher market price. We configured the Logstash grok filter to put these values into numerical Elasticsearch fields.
- Elasticsearch running at Servicelab. It’s turning into a great and scalable column store for unstructured, text-based data, including all the perks that come with Lucene. Like our log messages, including the numerical fields added by Logstash.
- Kibana running at Servicelab. It queries Elasticsearch to make pretty pictures from our logstash indices in a few clicks. We’re using it for real-time monitoring and data extraction (CSV). It’s one of the most powerful data visualization tools we’ve used to date and it’s getting better every day. We’re using Kibana 4 Beta 3 at the moment and looking forward to all the new features scheduled for the next milestones.

